
Many readers of this blog may already be aware that the Environmental Protection Agency recently started a national rulemaking process with the goal of creating a new program to reduce stormwater runoff. To prepare for this process, they put out a request for information about projects utilizing green infrastructure design techniques that mimic natural stormwater processes (evapotranspiration, infiltration, water recharge, etc.) and preserve pre-development hydrology.
The EPA then collaborate with the American Society of Landscape Architects (ASLA) to compile these projects in to case studies. All 479 case studies from 43 states, the District of Columbia, and Canada have now been released. We’re very happy to report that three projects that we were involved are among them: the Marq2 (Minneapolis, MN), Century College (White Bear Lake, MN) and Vandergrift Streetscape (Vandergrift, PA).
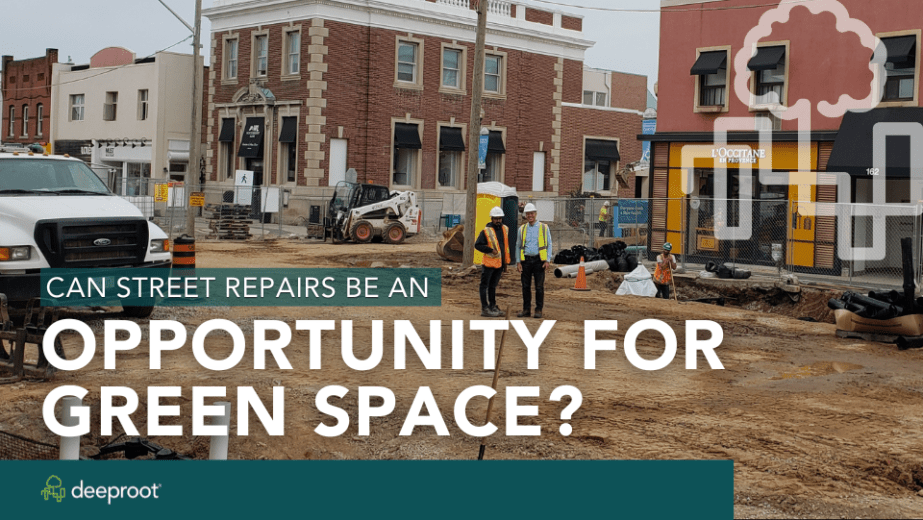
You’ve heard us talk about these projects here before; they’re some of the ones we’re the proudest of. The Marq2 project demonstrates how cities can save money using green infrastructure solutions, and Vandergrift is a great example of a regular town using trees and soil to meet stringent stormwater management standards. We’re immensely proud that all three were included.
The EPA and ASLA helpfully included a breakdown of the project information they by type, cost, and more. Check out those statistics below.
Project type:
Institutional/Education — 21.5%
Open Space-Park 21.3%
Other 17.6%
Transportation Corridor/Streetscape 11.9%
Commercial 8.6%
Single Family Residential 5.5%
Government Complex 4.2%
Multifamily Residential 3.7%
Open Space-Garden/Arboretum 2.9%
Mixed Use 1.8%
Industrial 1.1%
Estimated cost of green infrastructure:
$100,000–$500,000 — 29.2%
$1,000,000–$5,000,000 — 22.1%
$500,000–$1,000,000 — 13.2%
$50,000–$100,000 — 12.9%
$10,000–$50,000 — 12.1%
<$5,000,000 — 7.0%
>$10,000 — 3.5%
Green infrastructure type:
Retrofit of existing property — 50.7%
New development — 30.7%
Redevelopment project — 18.6%
How much impervious area was managed?
1 acre to 5 acres — 34.5%
5,000 sq/ft to 1 acre — 31.3%
greater than 5 acres — 24.8%
less than 5,000 sq/ft — 9.5%
Did use of green infrastructure increase costs?
Reduced costs — 44.1%
Did not influence costs — 31.4.7%
Increased costs — 24.5%
Green infrastructure design approaches used:
Bioswale — 62.1%
Rain garden — 53.2%
Bioretention facility — 50.8%
Porous pavers — 47.3%
Curb cuts — 37.9%
Cistern — 21.2%
Downspout removal — 18.1%
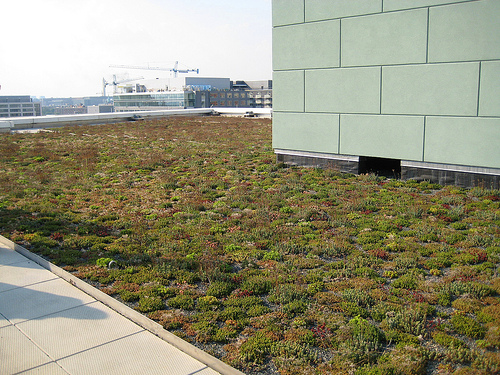
Green roof — 16.5%
Rain barrels — 5.7%
Other facts about the case studies:
- 55 percent of the projects were designed to meet a local ordinance.
- 88 percent of local regulators were supportive of the green infrastructure projects submitted.
- 68 percent of the projects received local public funding.
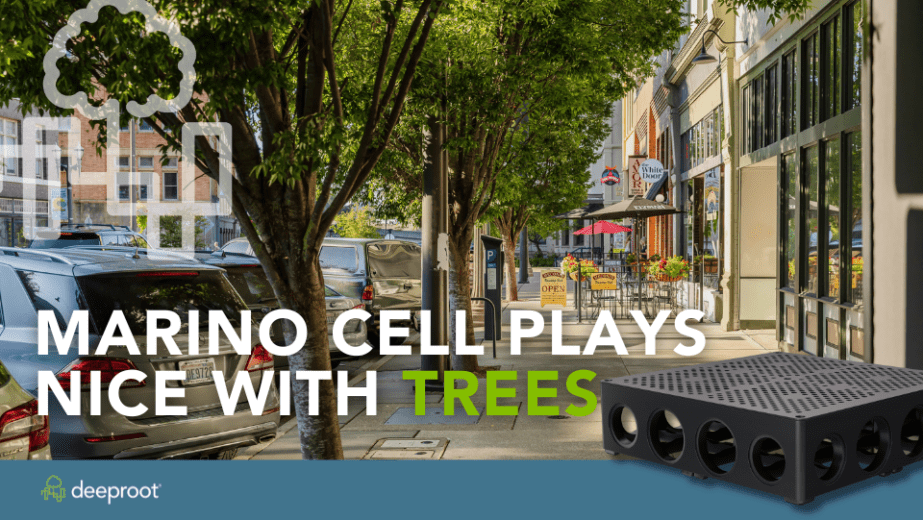
Despite all that is good about this project, there is one major oversight from our perspective — in the “Green infrastructure design approaches used” section, there is no acknowledgement of trees. Trees and soil in combination play an extremely powerful role in managing stormwater quantity and quality, and we possess the tools and the skills to bring those functions to cities and towns.
All of these statistics are interesting, but I find the last three bulletted “other facts” (above) the most compelling. Here is further evidence that green infrastructure is gaining tremendous acceptance as well as support — both fiscal and political. This is an indication to all designers and developers to continue to push for solutions that create more functional, healthier, and ecological urban environments.
Image: chesbayprogram

Leave Your Comment