We’ve been talking about doing it forever, and now we finally have: a lifecycle analysis that examines the investment vs. returns of street trees planted using traditional methods (4′ x 4′ cutouts) and in a suspended pavement (Silva Cell) treatment. Before we go any further, thanks are due to the Kestrel Design Group, in particular Nathalie Shanstrom, for preparing this research for us.
It is an accepted fact that mature trees can contribute significantly to healthier soil, air, and water in cities. But cities are not typically hospitable places for plant growth, and trees seldom live long enough to reach maturity and provide meaningful ecological services. Studies have found that trees surrounded by pavement and planted in heavily compacted soil in most urban downtown centers in North America only live for an average of 13 years (Skiera and Moll, 1992). This short lifespan deprives the areas most in need – the built environment – of the myriad benefits that trees can provide.
So why aren’t all urban trees planted with access to greater soil volumes that will enable them to live longer? Perhaps the main barrier to providing them with the rooting volume they need is that there higher up-front costs. But does the initial investment into suspended pavement pay off over the long term? This lifecycle analysis used i-Tree data for trees in Minneapolis, MN over a 50 year period to uncover what the actual return on investment is for an average street tree compared to a tree planted in a suspended pavement treatment, in this case a Silva Cell system with a bioretention soil mix for managing stormwater on site.
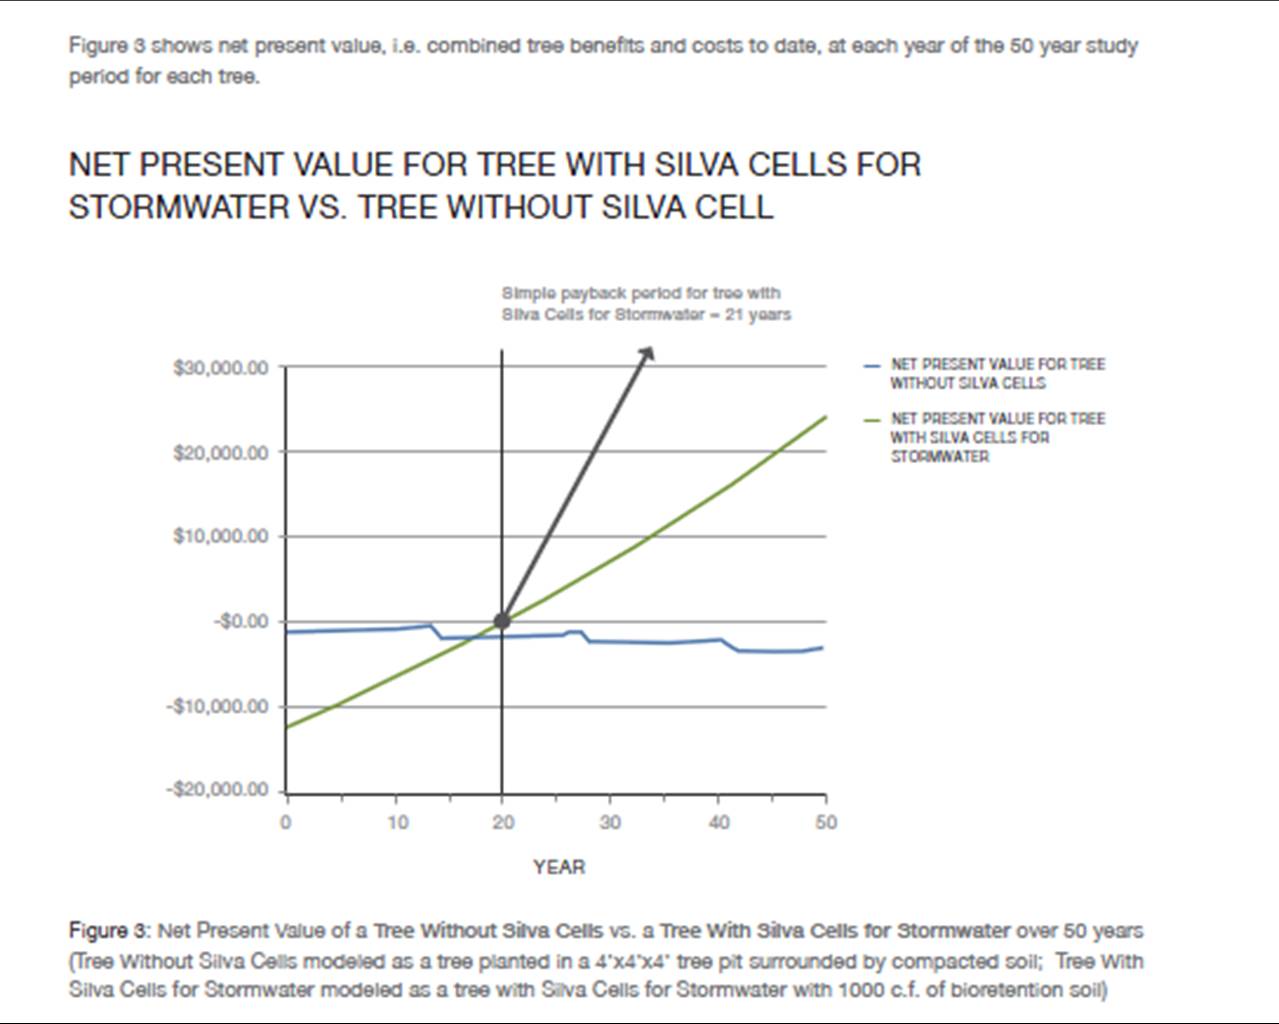
As you can see, the simple payback period for trees planted in Silva Cells is 21 years. This may sound like a lot, until you realize that trees planted in 4′ x 4′ cutouts never pay back their upfront costs at all — they just continue to cost you money. In an era of green streets initiatives and a push for high performance, sustainable landscapes, business as usual in the matter of tree planting doesn’t seem like the wiser choice at all (of course, we’re biased).
To read the full lifecycle analysis, which goes in to much greater detail on this topic and contains additional pretty charts and graphs, click here.





Leave Your Comment