
Silva Cells were installed at two test sites in Wilmington, NC in Fall 2012.
Back in December 2012, we reported the first preliminary results of Stormwater Treatment Performance Monitoring by Dr. William Hunt, Jonathan Page, and Ryan Winston, of two Silva Cell Systems in Wilmington, North Carolina.
Final results and statistics are expected later this summer. In the meantime, preliminary results are so promising that we want to share what they have learned so far.
Recap
To recap what they are monitoring:
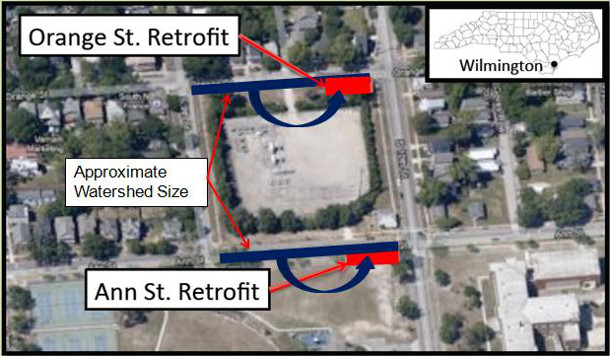
- The systems are installed on two adjacent residential streets, Ann Street and Orange Street:

Figure 1: Aerial view of Silva Cell Retrofit Sites in Wilmington (adapted from Jonathan Page, Ryan Winston and William Hunt, Bio & Ag Engineering, North Carolina State University)
- Each street has been installed with identical tree/soil/Silva Cell systems with one variable: one is planted with a standard tree planting growing medium, the other with the North Carolina bioretention medium. The main differences between the two soil mixes are that the standard tree planting medium has more organic matter and fine particles:Orange Street (North Carolina Bioretention Media
85-88% sand, 8-12% clay and silt by volume, 3% organic matter by weightAnn Street (Standard Tree Planting Media)
70% sand, 5% gravel, and 25% silt and clay by volume, 6 % organic matter by weight
- Both systems are lined with a pond liner.
- Runoff from the street is directed into the systems via a catch basin with a sump into a distribution pipe into the Silva Cell systems (see “A” on the image below).
- Underdrains with upturned elbows slow water and then direct runoff into the City’s existing storm sewer system (see “B” on the image below).
- Wilmington has an average annual precipitation of 57.61 inches (146.32 cm), and a mean temperature of 64.0 degrees F (data from NOAA; Period used to compute averages and normals: 1981-2010)
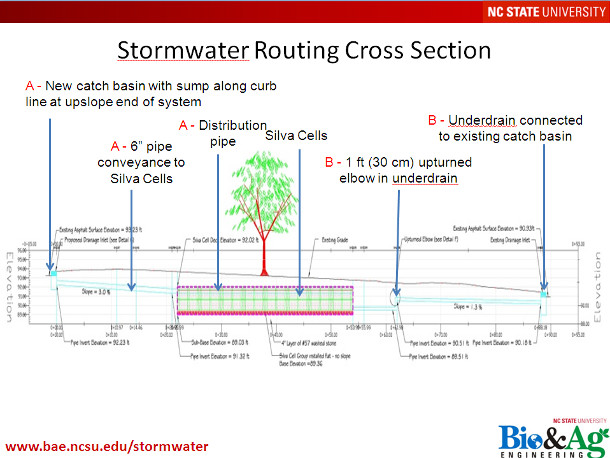
Figure 2: Stormwater Routing Cross Section (Courtesy of Jonathan Page, Ryan Winston and William Hunt, Bio & Ag Engineering, North Carolina State University)
Contributing drainage areas to each Silva Cell/Tree/Soil system are summarized below:
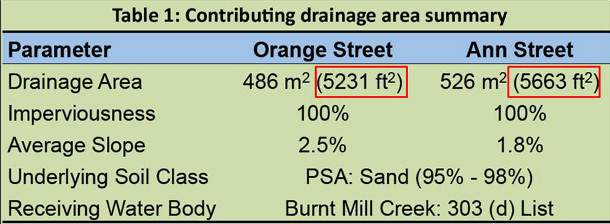
Table 1: Contributing Drainage Area Summary (Courtesy of Jonathan Page, Ryan Winston and William Hunt, Bio & Ag Engineering, North Carolina State University)
Drainage area to each of these Silva Cell/Tree/Soil systems is significantly greater than it would be in a typical installation. In a typical installation, there would be more than just one tree capturing runoff from this watershed. If, for example trees were spaced 30’ apart, there would be 10 trees capturing the runoff that is currently being captured by one tree at each of these test sites. If the trees were 30’ apart, and the street was 22’ wide from crown to curb, the watershed for each tree would be 660 square feet (61 square meters) per tree, almost 10 times smaller than the watersheds here (5,231 square feet and 5,663 square feet).
Preliminary Results
Volume Benefits
Average runoff volume reduction is 30 percent. Figure 1 shows the hydrograph of a 12.7 mm (0.5 inch) storm at the Ann Street Site, on 9/6/12, showing significant peak reduction.
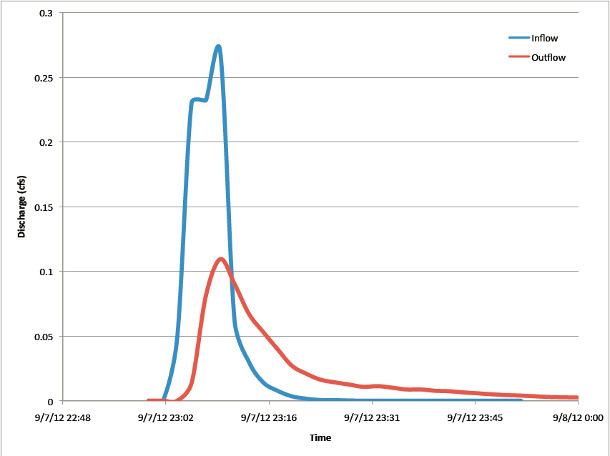
Figure 3: hydrograph of a 12.7 mm (0.5 inch) storm at the Ann Street Site, on 9/6/12, showing significant peak reduction.
Runoff volume reduction in a typical installation is expected to be significantly greater than what we are currently seeing at the Ann and Orange Street demonstration sites because:
1) As mentioned above, drainage area to each of these Silva Cell/Tree/Soil systems is significantly greater than it would be for a typical installation. In a typical installation, there would be more than just one tree capturing runoff from this watershed. If, for example, trees were spaced 30 feet apart, there would be 10 trees capturing the volume of runoff that is currently distributed to just one tree at this site, and only very minimal outflow, if any, would be expected from a water quality storm event. Whereas the watershed of each of these test Silva Cell Systems is more than 5,000 square feet (see Table 1, contributing drainage area summary), in a more typical Silva Cell application, if, for example, trees were 30’ on center and the street was 22’ from crown to curb, the watershed per tree/soil system would only be 660 square feet per tree/soil system – almost 10 times smaller than the watersheds here (5,231 square feet and 5,663 square feet).
2) These two Wilmington test systems are lined with an impermeable liner for research purposes, so the only way to abstract volume from these systems is through evapotranspiration. A typical Silva Cell installation would not be lined, so additional volume reduction would be expected through exfiltration out the bottom and sides of the system.
Water Quality Benefits
Water quality impacts are summarized in Tables 2 and 3 below. Definitions and abbreviations are listed in Appendix A at the end of this post. To date, 13 water quality samples have been collected from Ann Street, and 9 water quality samples have been collected from Orange Street sites. Sampling will continue through summer 2013 until 16-18 sets of samples have been collected from both retrofit sites.
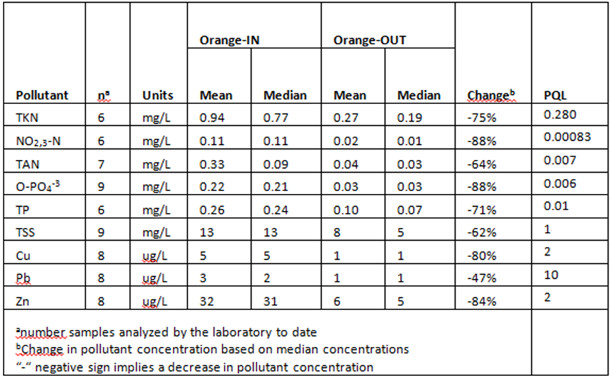
Table 2: Water Concentrations Summary from Orange Street Silva Cell Retrofit Site (NCSU Bioretention Soil) to Date (Median values reported) (mg/kg) (Table Courtesy of Jonathan Page, Ryan Winston and William Hunt, Bio&Ag Engineering, North Carolina State University)
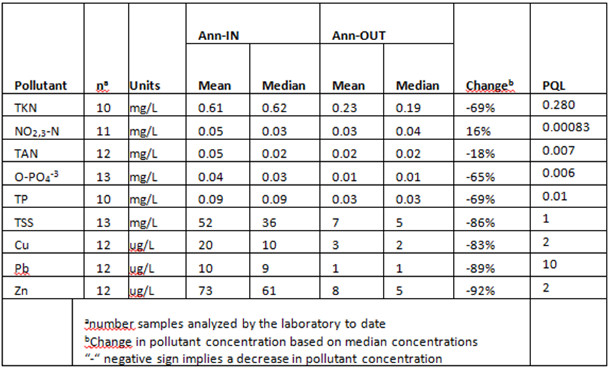
Table 3: Water Concentrations summary from Ann Street Silva Cell Retrofit Site (Typical Street Tree Planting Soil) to Date (Median values reported) (mg/kg) (Table Courtesy of Jonathan Page, Ryan Winston and William Hunt, Bio&Ag Engineering, North Carolina State University)
In general, influent concentrations at the Ann Street and Orange Street sites were low for all pollutants compared to other sampling locations in Wilmington, NC and the U.S. (Table 4, below). Nutrient concentrations (TKN, TAN, NO2,3-N, O-PO4-3, TP) at the Ann Street inlet are particularly low. In some instances effluent concentrations are below the practical quantification limit (PQL). Where influent concentrations (i.e., the pollutant concentrations of the water going into the Silva Cells) are low, it is particularly important to evaluate a BMP by the effluent concentrations rather than by the percent removal. This is because in Best Management Practices (BMPs) where the water going in is relatively clean, and the water going out is still clean, the BMP could have low percent removal even though the water going out is clean, because the water going in was already clean.
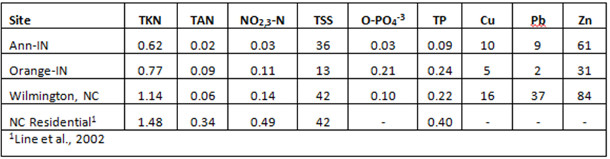
Table 4: Influent water quality concentration comparison (mg/L) (Table Courtesy of Jonathan Page, Ryan Winston and William Hunt, Bio&Ag Engineering, North Carolina State University)
Both Silva Cell Systems are showing excellent reduction of:
- metals (Cu, Pb, Zn)
- TSS
- Phosphate
- total Kjeldhal nitrogen (TKN)
- Total ammoniacal nitrogen (TAN)
The NCSU soil mix also showed excellent nitrate removal.
We are especially encouraged because these preliminary results show good nutrient (TP, O-PO4-3, TKN, TAN) removal. Controlling nutrients in bioretention effluent is extremely important to protect water quality of receiving water bodies: phosphorus is typically the limiting nutrient in fresh water systems, and nitrogen is typically the limiting nutrient in salt water bodies. While bioretention systems typically show excellent TSS and metals removal, some bioretention systems leach nutrients out of the compost in the bioretention soil.
Both the Silva Cell/Tree/Soil systems show excellent TP, O-PO4-3, and TKN removal. The bioretention soil, which had a lower organic matter content, also showed excellent nitrate and TAN removal. TAN effluent concentration at the site with higher organic matter content also looks promising, even though percent removal was lower. The installation with the higher organic matter content (Ann St), was even slightly lower than that at the installation with lower organic matter content (Orange Street), but percent removal was lower at Ann St. because the influent at Ann St. was much cleaner than that at Orange St. to begin with.
Stay tuned for final results to be released in the next few months!
Appendix A: Abbreviations
PQL = 99 percent confidence intervals for detection
TKN = all the nitrogen except nitrite and nitrate, see below for more detail
Total Nitrogen is defined as the sum of organic nitrogen, nitrate, nitrite, and ammonia:
Total N = Organic N + NO3–-N + NO2–-N + NH3-N
N = Nitrogen
NO3–-N = Nitrate nitrogen,
NO2–-N = Nitrite nitrogen, and
NH3-N = Ammonia nitrogen
By definition, TKN (Total Kjeldahl Nitrogen), a component of total nitrogen, is the sum of organic nitrogen and ammonia. Therefore, the above equation may be re-written as:
Total N = TKN + NO3–-N + NO2–-N
So, TKN is all the nitrogen except nitrite and nitrate
NO2,3-N : NOx = nitrate and nitrite
TAN: TAN is essentially the same thing as NH4. TAN is the sum of NH3 and NH4, but the vast majority of ammonia is in the ammonium phase (NH4) at normal pH.
O-PO4-3: phosphate
TP: total phosphorus
TSS: total suspended solids
Cu : copper
Pb : lead
Zn : zinc
Nathalie Shanstrom is a sustainable landscape architect with The Kestrel Design Group.


Leave Your Comment