So you want to understand your urban forest better. Maybe it’s that you want to make the business case for its value, or understand where your tree canopy is strong and where it could still use work to help guide policy or budget decisions.
In part 1 of this series, I gave a cursory overview of the different i-Tree tools and what they can do. Today, I’ll make those tools personal by examining a study done with i-Tree: Urban Trees and Forests of the Chicago Region, (Nowak et al 2013). This is not a study I was personally involved in, rather I am using it as an example of a very recently-published, large-scale study that demonstrates what the i-Tree tools are capable of and how they can help you better understand your urban forest and make smarter, better, informed decision about its care and its future.
The “Urban Trees and Forests of the Chicago Region” study was done by the Morton Arboretum in collaboration with the U.S. Forest Service. The main goal of the Chicago Region Urban Forest i-Tree study was to determine the vegetation structure, functions, and values of the trees in the Chicago Region to better inform forest management. The Chicago Region is defined as the City of Chicago and the seven counties surrounding it: Cook, DuPage, Kane, Kendall, Lake, McHenry, and Will. To accomplish the project goals, 2076 one-tenth acre plots were sampled during the summer of 2010 and analyzed using i-Tree eco. The study included “boulevard trees, trees planted in parks, and trees that naturally occur in public rights-of-way, as well as trees planted on private or commercial properties.” They defined trees as “woody plants with a diameter greater than or equal to 1 inch at breast height (d.b.h.).” As a result, some species that are commonly considered shrubs were considered trees in this study if their d.b.h. was equal to or greater than 1 inch.
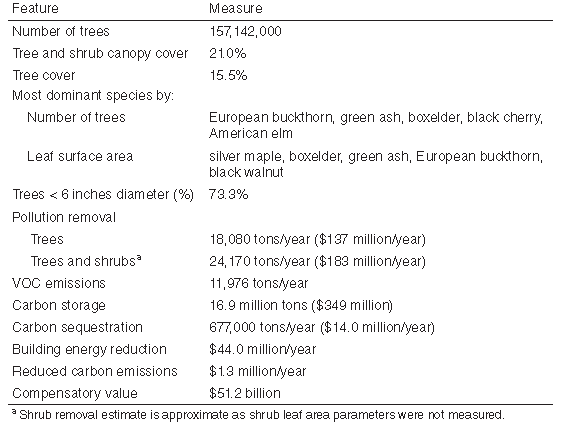
Table 1 summarizes their findings at a glance.
We can see from this table that the trees in this area provide significant benefits: for example, this urban forest provides an estimated $349 million of value just in carbon storage benefits! The estimated compensatory value of this forest is $51.2 billion.
However, from this table, as well as more detailed information in this report, it is also evident that significant changes in the structure and composition of this forest are still needed to maximize benefits of this urban forest, including:
- More trees
- Changes in species composition
- Change in age stratification
I’ll walk through each of these conclusions in more detail.
More Trees
According to Dwyer and Nowak (2000), tree canopy cover in urban and metropolitan areas across the U.S. averages 27% and 33% respectively. Tree cover in the Chicago Region, in comparison was only 15.5% (21% tree and shrub canopy cover), almost half the national average. More trees would clearly be the first step in increasing the benefits provided by the urban forest. Compared to national averages, Chicago could make major improvements in this area.
Changes in species composition
Not only is canopy cover relatively low in the Chicago region, 38.4% of the canopy cover consists of invasive species. European buckthorn is by far the most common species, comprising 28.2% of this forest. The next most common species are Green Ash and Box Elder, each at 5.5% of the regional forest. While ash trees have the greatest leaf area of all species in this region, and ash is the second most common tree in this region (after buckthorn), most ash trees are expected to be lost to Emerald Ash Borer (EAB) in the near future.
And ash is not the only common tree vulnerable to deadly insect or disease in this forest. This study determined that the following five insects or diseases pose a threat to the Chicago Regional Forest because they currently exist or have existed on the Chicago region: Asian longhorned beetle (ALB), gypsy moth (GM), emerald ash borer (EAB), oak wilt (OW), and Dutch elm disease (DED). Of these, ALB is the only one that has been eradicated in this region. Because 7 out of 10 of the most common species in this forest are vulnerable to one of these five diseases, this forest is very vulnerable. Moreover, two out of the only three of the 10 most common species that are NOT vulnerable to catastrophic insect and disease outbreaks are invasive species: European buckthorn and amur honeysuckle.
Potential loss from any one of these insects or disease is well over a billion dollars in compensatory value: “If ALB reinfests the Chicago region and the infestation goes unchecked, the effects to the forests could be devastating with a potential loss greater than 41.6 million trees (greater than one fourth of the forest; $17.4 billion in compensatory value). Potential loss of trees from GM is 17.7 million ($18.5 billion in compensatory value), EAB is 12.7 million ($4.2 billion in compensatory value), OW is 9.0 million ($16.0 billion), and DED is 8.2 million ($1.6 billion).” (Nowak et al 2012).
Clearly, more species diversity, reduction in invasive species cover, and less emphasis on species vulnerable to insect and disease are greatly needed in this regional forest.
Change in age stratification
This study also illustrates the importance of large trees for providing ecological services: the greater the leaf area, the greater the benefit.
While 73% of the trees in the Chicago region have diameters less than 6 inches, they provide only 21.6% of the total leaf area. Only 4.8% of the tree population had a d.b.h. greater than 18”, but these trees provided 32.7% of the total leaf area. Figure 1 demonstrates how that average carbon storage and sequestration benefits increase dramatically as trees increase in size. In other words, Chicago needs not only more trees, they need bigger and more mature trees!
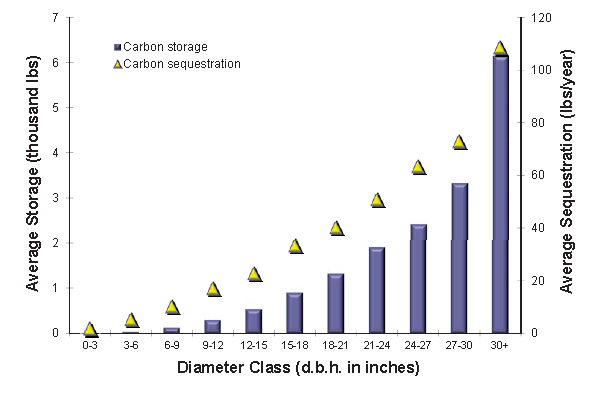
Figure 1: Estimated average carbon storage and sequestration by diameter class, Chicago region, 2010 (from Nowak et al, 2012)
Several of the most common large diameter tree species had very few small diameter trees. Bur oak and white oak, for example, had a much greater proportion of large trees than small trees, indicating that without active management, there are not enough small oaks to sustain the population of large oak trees over time.
Conclusion
This report illustrates the importance of analyzing the urban forest’s current condition to inform future planning and management decisions on a regional scale. In its conclusion, the authors write: “To sustain and enhance the forest and the benefits it contributes amidst these major challenges, a comprehensive and integrated management strategy must be developed and implemented across the region. The “Tree Census” and analysis summarized here are the platform on which to build the strategy—taking action for the benefit of the entire Chicago region and beyond.”
If you are interested in learning more about this study, or in seeing more examples of what others have done with i-Tree, you can find a report on this study and reports of many more i-Tree studies on their website.
References
Dwyer, John F.; Nowak, David J. 2000. A National Assessment of the Urban Forest: An Overview. Society of American Foresters 1999 National Convention Portland, Oregon. p. 157-162.
Nowak, David J.; Hoehn, Robert E. III; Bodine, Allison R.; Crane, Daniel E.; Dwyer, John F.; Bonnewell, Veta; Watson, Gary. 2013. Urban trees and forests of the Chicago region. Resour. Bull. NRS-84. Newtown Square, PA: U.S. Department of Agriculture, Forest Service, Northern Research Station. 106 p.
Part 1: Using i-Tree to Analyze the Structure, Function, and Value of Community Forests
Part 3: A case study in using i-Tree at a City Scale
Nathalie Shanstrom is a sustainable landscape architect with the Kestrel Design Group.


Leave Your Comment