We have long known that urban trees help mitigate air pollution. But what about questions of how significant that mitigation is, how we track it, and where it occurs? A 2014 paper, “Assessing the relationship among urban trees, nitrogen dioxide, and respiratory health” by Linda George, Meenkashi Rao, Todd Rosenstiel, Vivek Shandas, and Alexis Dinno examined these questions relative to nitrogen dioxide pollution in Portland, OR. Their results are fascinating, and suggest that in-situ measurements predict “significantly higher reduction of NO2 by urban trees than do existing models.” What does this really mean – and what is the implication for eco-benefits tools like i-Tree? I spoke to Linda George to learn more about their study, what people seeking to quantify urban tree benefits need to know, and what designers and policymakers should be considering as we look to a denser and more urbanized future. Our conversation has been edited and condensed. –LM
Your paper is called “Assessing the relationship among urban trees, nitrogen dioxide, and respiratory health” – why were you interested in this topic?
It started over a decade ago, and honestly, at that time my focus was entirely on the chemistry of pollution in the atmosphere – I’m an atmospheric chemist and I wasn’t thinking much about the sources on the bottom, nor was I interested in them. Then an environmental justice group here in Portland approached me asking for my help understanding the likely impact to nearby residents of expanding the I-5 highway north. That was when my interest in neighborhood scale sources of pollution – and mitigation – started.
What did you find?
First, let me explain that making measurements of air pollution generally requires very expensive equipment, so in this case, making a spatially-intensive assessment using standard methods was basically out of the question. But I stumbled on a low-cost, but accurate way to measure Nitrogen Dioxide (NO2) and decided to try it out, although I wasn’t really expecting all that much to come of it. Unlike the standard method, this low cost method isn’t a continuous measurement but gives us a snapshot of the concentration over a two-week period.
During the course of working with the environmental justice group, I was surprised to hear public officials at meetings I attended about the project claim that pollutants disappeared completely, or were unimportant, once they were 25 feet from the source, which seemed very unlikely to me.
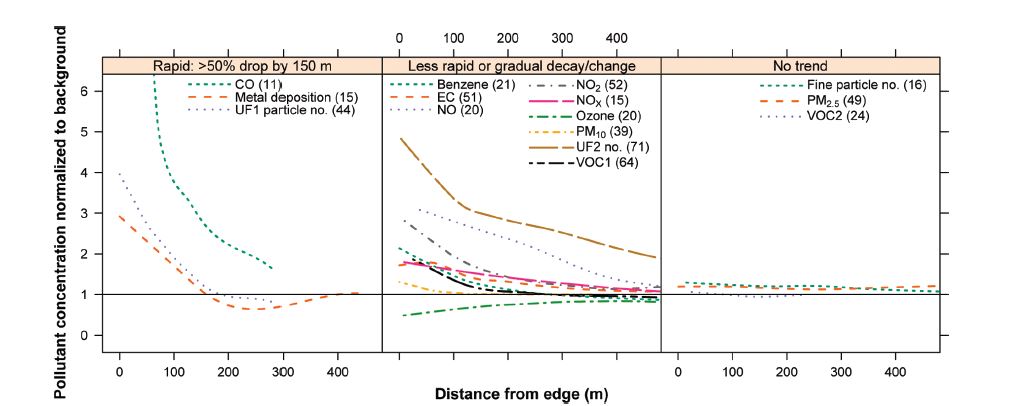
Changes in pollutant concentrations over distance. Rapid initial concentration decay, defined here as at least a 50% decrease in peak concentration by 150 m, followed by more gradual decay toward background. The second consistently decayed or changed over the entire distance range, while the third showed no trend with distance.
Graph courtesy of A. Karner et al. / Environ. Sci. Technol. 2010, 44, 5334–5344.
I went ahead with the study and was astonished to find that NO2 concentrations were twice as high in the neighborhoods on East side of the I5 highway as they were on the West side because of prevailing winds. So one, people were being affected by a local source and, two, they were being affected disproportionately based on their locations (disproportionate in the sense that the high level of emissions from I-5 are not due to local residents but due to commuter traffic from Vancouver, WA).
How did that lead to this paper, on the effect of trees on NO2 pollution?
After the first (2008) study, I became interested in the NO2 variability across Portland, not just around the I-5. So my colleagues and I looked at spatial variability of NO2 pollution across the city and saw that there seemed to be some association with lower NO2 levels and the presence of trees.
Knowing that freeways and roadways are a big driver of spatial variability of pollutant levels got me thinking… roadways aren’t going away anytime soon, so how can we mitigate the pollution with trees? We (including my colleagues Vivek Shandas and Todd Rosenstiel) wanted to find out if that was viable.
We already knew that in areas with a lot of trees and parks, there were lower concentrations of NO2, but we didn’t know whether that was due to there being an absence of sources of NO2, or because the trees were actually removing NO2 from the air. That’s what we wanted to find out, so we got a grant from the U.S. Forest Service to investigate further. Doctoral student Meenakshi Rao carried out this work and it is part of her dissertation.
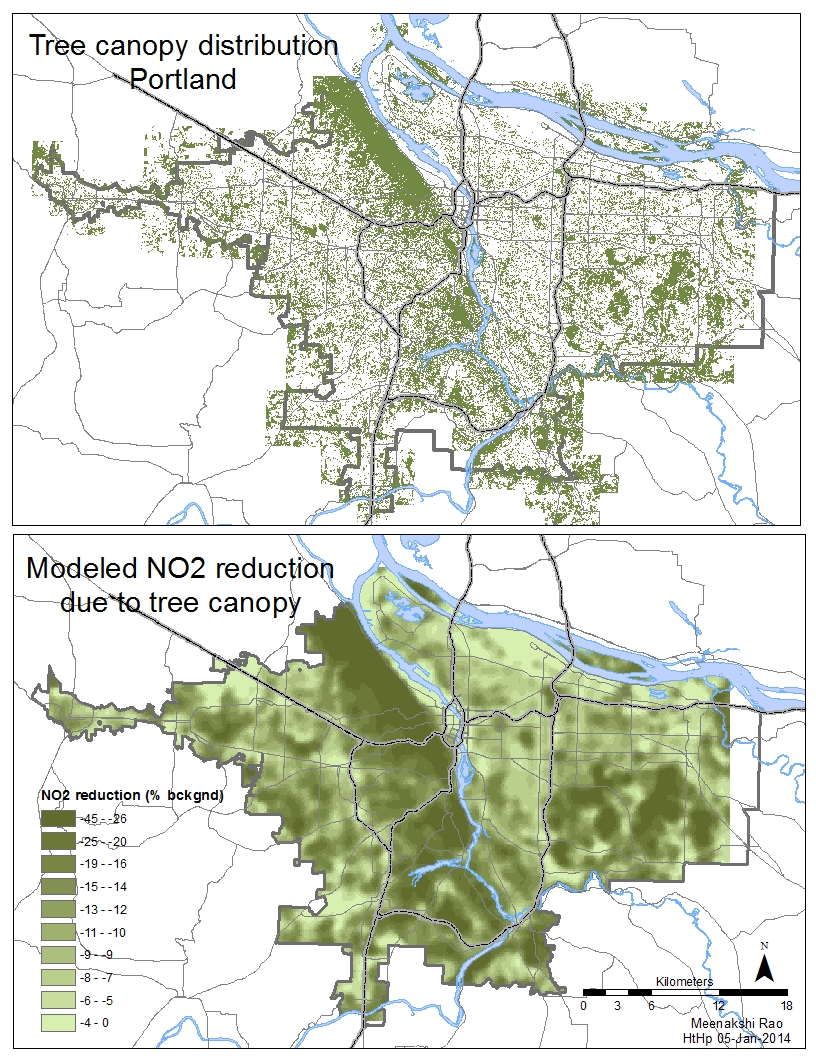
Graph courtesy of M. Rao et al. / Environmental Pollution 194 (2014) 96-104.
Why did you study NO2? What effect does NO2 have on human health?
NO2 is nitrogen dioxide and is a “criteria pollutant,” which means states are legally required by the Environmental Protection Agency (EPA) to keep it below certain levels that are considered hazardous to human health. (Even below the EPA levels, it has still been associated with things like asthma).
On a practical level, NO2 is easy to measure – and, more significantly, it’s also co-polluted with other things that have a big impact on human health, like particulate matter (PM). By following NO2, we’re also tracking other emissions – basically what’s coming out of the tailpipe of combustion sources (cars, trucks, trains, etc.).
Your paper said you used a land-use regression model to assess the spread of pollutants. What is that?
The model helps you figure out which land use characteristics are affecting the sample that you’ve collected.
The idea is that you take a of pollutant concentration measurement in a geographic place. You then look at the land use around that measurement site at various size buffers called “zones of influence.” We determine if a collection site is by a roadway, in an industrial area orin a park, a clump of tree canopy or a combination of these. All these conditions (and more) could occur within a 500 m buffer of a particular measurement.
Once you have a big enough sample, you can compare measurements across sites and begin to attribute variability to different site characteristics.
What kind of sample size did you have in your study?
Normally, people looking at spatial variability of pollutants set out about 40 samplers. That would give you a general map of spatial variability, but if you want a sense of what is driving a variation with statistical confidence, you need more. So we used a lot of samplers – 144 in total!
Did you find that trees were responsible for pollutant removal?
Because we had such a big sample size, we were much better positioned to disentangle the question of whether lower NO2 measurements were explained by a lack of roadways, or by the presence of trees.
Ultimately, we concluded that it was the presence of trees that explained the concentration reduction. We’re not alone in making this claim, although we are making it more strongly – and saying there is a more sizable affect – than others have.
Are you saying trees have a more sizable effect on NO2 reduction than, say, a tool like i-Tree captures?
Yes.
How much more of an effect are we talking about?
Well, if you run i-Tree to model the same area we studied, it would tell you that the NO2 uptake by trees in Portland is about 1 percent. Our findings suggest trees uptake 10 percent – a huge difference.
Why the discrepancy?
We’re not completely sure, but we guess that it may have something to do with the fact that Dave Nowak, who developed i-Tree, used NO2 uptake parameters developed by looking at trees in pristine, forest conditions. Our finding of 10 percent NO2 uptake is based on actual measurements.
i-Tree a powerful first-step tool to try to put valuation on greenery, and it’s absolutely rooted in science. But to date there’s been no interurban validation of those drivers. Now we need to validate these models, so that we can tweak them for the real (urban) world that trees live in. We’re a long way away from fully understanding what’s going on with urban trees.
We’re going to be looking more into the other factors – the volume, surface area, and mass of the tree, its habit, type, etc. – that could affect rates of uptake.
Are you saying that our current tools – specifically i-Tree – are likely underreporting the NO2 benefits provided by trees?
Exactly – by an order of 10, potentially.
What are the implications for i-Tree modeling software?
This is still in the early stages. We’ve opened up the conversation with Dave to share our findings, but there is a lot more research to do before this really affects people and organizations using i-Tree to calculate eco benefits. It could simply be that we need more than one method of calculate eco-benefits from trees.
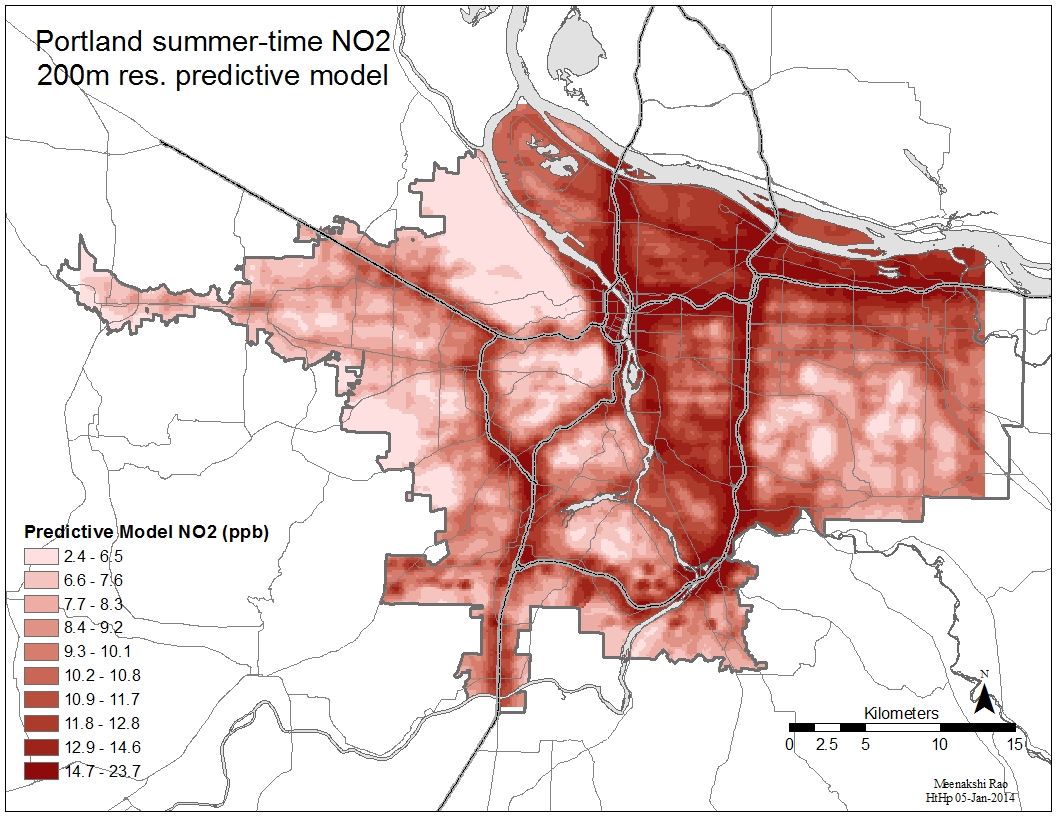
Graph courtesy of M. Rao et al. / Environmental Pollution 194 (2014) 96-104.
What is unique or unusual about your findings?
We’re not the first to find that trees are associated with a significant reduction in NO2, but we demonstrated for the first time that that the landscape-level reduction of NO2 levels is significant enough to contribute to improved human respiratory health.
Tell me more about that. What kind of improvement in human health did you estimate?
Our estimates suggest that the potential annual respiratory health benefit associated with trees in Portland due to reduction in NO2 is approximately 21,000 fewer incidences and 7,000 fewer days of missed school due to asthma exacerbation for 4-12 year-olds; 54 fewer ER visits across people of all ages; and 46 fewer cases of hospitalization due to respiratory problems triggered by NO2 in the elderly.
The economic value of these health benefits is approximately $7 million (2013 USD).
That’s a huge amount of money!
It is. And NO2, while not good for human health, it not the biggest form of pollution with ill effects! Particulate matter causes even more serious conditions, and we’re looking at how to do spatial measurements for that now.
What is the implication for cities and public health organizations?
The regulatory framework for air pollutants, in the U.S. at least, is based on assessing air quality on average for a city. So in Portland, a city of over 600,000 people, there is only one NO2 monitoring station – and that is supposed to represent the NO2 levels that all residents of Portland experience.
Common sense tells us that spatial variability is a major factor in pollutant concentration, though: in other words, what you experience depends on where you live. Our paper showed that if you calculate health impact based on an average as opposed to spatial variability, you get very different numbers.
If we should be monitoring air pollutants at a highly local level in order to correctly assess health impacts, what does that mean for policymakers, planners, arborists, and designers?
It means that we can’t just pay attention to something like densifying areas – we have to also pay attention to how densification affects air pollution.
For example, Portland has really promoted densification of the city. There are certainly a lot of benefits of this, but with higher concentrations of people and closer proximity to transportation corridors comes increased exposure to pollutants. We can’t build “green” without paying attention to air quality and how to mitigate the increases that come with vehicle transportation.
Our study looked at a decade of data about population, and it showed that people are moving to dense areas with higher concentrations of traffic and pollutants. These are areas that will see bigger impacts. We have to recognize that there is variability in pollution distribution and therefore variability of health impacts. Smart design, and smart public policy, should reflect that understanding.
You can download “Assessing the relationship among urban trees, nitrogen dioxide, and respiratory health” here. Todd Rosenstiel also contributed. Thanks, Linda and Todd!


Leave Your Comment